本文使用的案例是:分析对餐厅的评价,判断是正面评价还是负面评价
1 分类器(Classifiers)
一个最最原始的分类器是:分别计算每条评论中的积极单词(great,awesome,good,···)和消极单词(terrible,bad,awful,···)的数量,如果积极单词比消极单词多,那么为正面评价,反之则为负面评价。
1 | # Simple threshold classifier |
但是上述方法有很多问题:
- 怎样列举积极单词和消极单词?
- 每个单词有不同程度的情感(比如:great > good)
- 只分析单一的单词有很多局限(比如:good 是积极的,not good 是消极的)
2 线性分类器(Linear classifiers)
为了解决上述前两个问题,我们利用训练集来学习每个单词的权重。例如:
| Word | Weight |
|---|---|
| good | 1.0 |
| great | 1.5 |
| awesome | 2.7 |
| bad | -1.0 |
| terrible | -2.1 |
| awful | -3.3 |
| restaurant, the, we, where, … | 0.0 |
| … | … |
input x:
Sushi was great, the food was awesome, but the service was terrible.
Score(x) = 1.5 + 2.7 - 2.1 = 2.1
我们称其为线性分类器,是因为结果是每个单词的权重之和
1 | # Simple linear classifier |
3 决策边界(Decision boundaries)
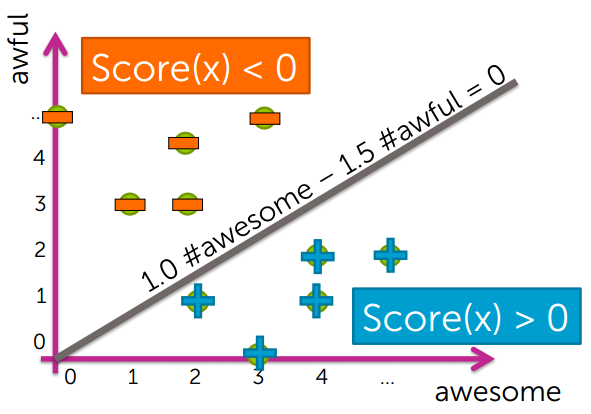
如果一个线性分类器只支持 2 个单词:
| Word | Weight |
|---|---|
| awesome | 1.0 |
| awful | -1.5 |
那么 Score(x) = 1.0 #awesome – 1.5 #awful
我们发现它的决策边界是一条直线:
3.1 决策边界的形状
Decision boundary separates positive & negative predictions
- For linear classifiers:
- When 2 weights are non-zero:line
- When 3 weights are non-zero:plane
- When many weights are non-zero:hyperplane
- For more general classifiers
- more complicated shapes
4 评估分类器(Evaluating classifiers)
4.1 误差率与正确率(error and accuracy)
误差率 error:
$$error = \frac{mistakes}{total}$$
正确率 accuracy:
$$accuracy = \frac{corrects}{total}$$
误差率和正确率的关系:
$$error = 1 - accuracy$$
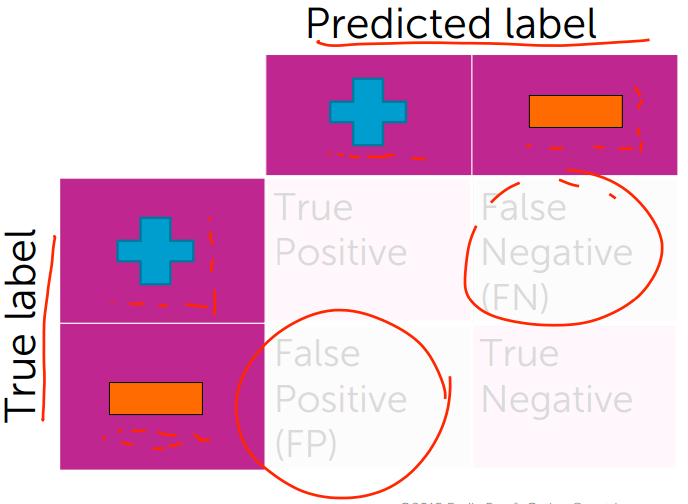
4.2 混淆矩阵(Confusion matrices)
5 学习曲线(Learning curves)
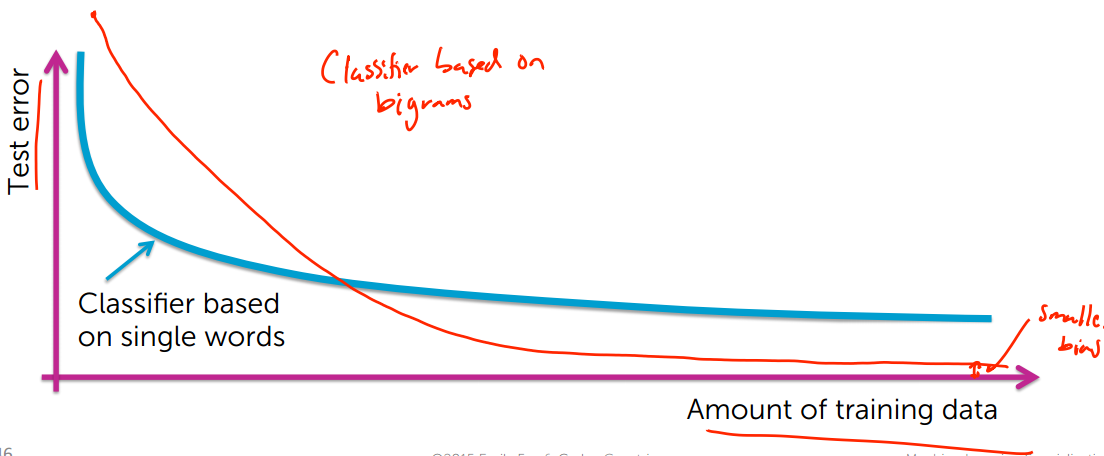
学习曲线把训练数据量和测试误差率联系在一起
随着训练数据增多,测试误差率会越来越低
注:在上图中,蓝色线代表基于单个单词的分类器,红色线代表基于双连词的分类器(就是两个单词连在一起)
一个模型需要学习多少数据和模型复杂度之间的关系:
一般来说,一个模型的参数越多,学习这个模型需要的数据越多
我们从上图也可以分析出,当参数增加(基于双连词的分类器)时,如果数据量不够,那么效果不如参数少的分类器(基于单个单词的分类器),偏差较大;当数据量足够多时,效果好于参数少的分类器,偏差较小,但是也不会为 0。
6 分类概率(Class probabilities)
比如:输入一条评论,输出这条评论的情绪为正或负的概率
7 案例分析:分析 Amazon 婴幼儿产品的评价
代码在这里


