1 启动 GraphLab Create
The first time you use GraphLab create, you must enter a product key to license the software for non-commerical academic use. To register for a free one-year academic license and obtain your key, go to dato.com.
1 | import graphlab |
2 SFrame
- to obtain the full path of the home directory of IPython notebook. This path is where your files should go.
1
2
import os
print os.getcwd() - Place any files (notebooks and datasets) under the home directory. You may organize your files using sub-folders.
将所有文件(包括文本文件和数据集)放在家目录下。可以使用子文件夹 - 用 SFrame 读取表格数据集(use SFrame to load a tabular data set)
1
sf = graphlab.SFrame('people-example.csv')
2.1 SFrame basics
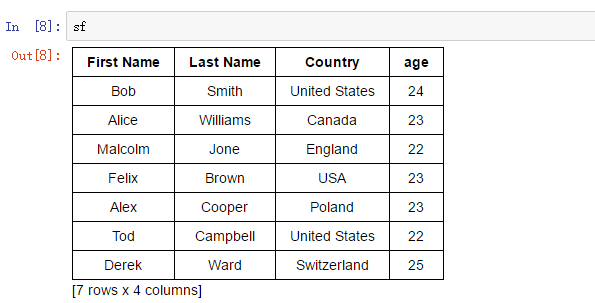
- 显示表格开头几行或者
1
sf # we can view first few lines of table
1
sf.head() # we can view first few lines of table
- 显示表格最后几行
1
sf.tail() # view end of the table
2.2 GraphLab Canvas
将GraphLab Create 中任何一个数据结构可视化
1 | # 这将会在浏览器中打开一个网页来显示可视化数据 |
在 IPython Notebook 中打开(而不是在浏览器中打开)(没有成功)
1 | # .show() visualizes any data structure in GraphLab Create |
2.3 查看数据集的列
1 | # 查看“Country”列 |
运行结果:
1 | dtype: str |
1 | # 查看“age”列 |
运行结果:
1 | dtype: int |
一些简单的运算:
- 平均值运行结果:
1
sf['age'].mean()
1
23.142857142857146
- 最大值运行结果:
1
sf['age'].max()
1
25L
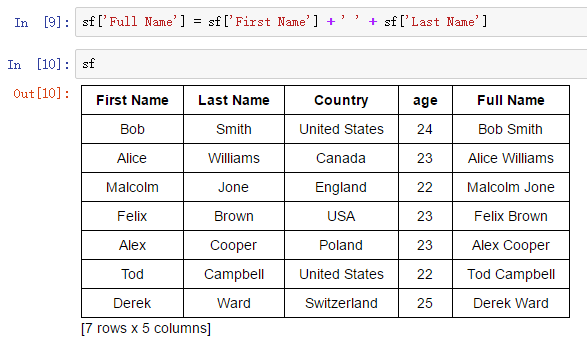
2.4 建立新的列
在机器学习中,经常会把一些列进行转换,然后成为新的一列,这被叫做特征工程
将“age”列都加 2:
1 | sf['age']+2 |
运行结果:
1 | dtype: int |
得到“age”列的平方:
1 | sf['age'] * sf['age'] |
运行结果:
1 | dtype: int |
2.5 使用函数 apply() 进行数据转换
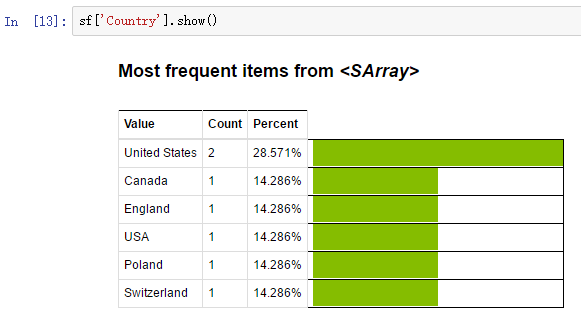
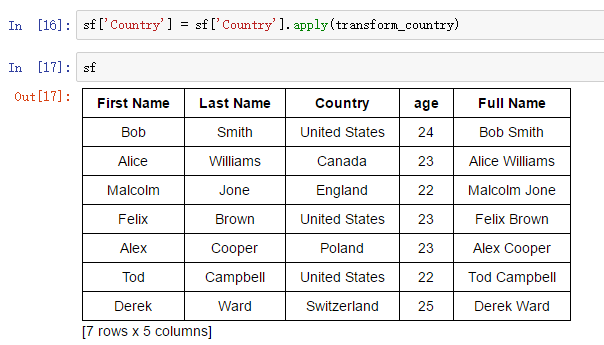
在前面的表格中,我们发现“Country”列有的值为“United States”,有的为“USA”,这会影响到计数等操作,所以我们希望将所有的“USA”都转换为“United States”
查看“Country”列
编写函数:
测试:
将函数作用在“Country”列的每一行,并将值赋给在“Country”列,查看效果


